Michael Lowry and Dr. Eric Christiansen, Geology Department
Introduction
Mars, especially the region known as the Tharsis Bulge, is replete with volcanoes and other evidences of volcanism. The morphology of these volcanoes and the relative ages of lava flows and other features grant important insight into the history of the planet, the tectonic setting of the volcanoes, and the rheology of the eruptive lava. Syria Planum is a high volcanic plain located in the center of the Tharsis Bulge in the western equatorial region of Mars. The entire plain is covered with lava flows, low shield volcanoes, calderas, and faults. The purpose of this study was to collect and georeference CTX images provided by NASA from the Mars Reconnaissance Orbiter, create DEMs of the surface of Syria Planum, and create and interpret a map of the geologic features of the planum. The focus area of this map and interpretation is on the southwestern portion of Syria Planum, specifically the lava flows generated by Syria Mons and flowing southeast therefrom.
Methods
The CTX images provided by the Mars Reconnaissance Orbiter are much higher resolution than the standard base map of Mars provided by the MOLA mission, and allow a more detailed geomorphic study of the volcanoes than ever before. However, until this study, there was not a simple, standardized way to retrieve, catalog, analyze, and process CTX data. We found two programs that were useful for this process. There is a python script written by Trent Hare from the United States Geological Survey that attaches georeference data to a CTX image for convenient use with ArcMAP. MarsSI is another program created by the University of Lyon in France that can process georeferenced CTX images. MarsSI uses overlapping CTX images to create a DEM, which can be viewed with color gradients to help distinguish elevation changes. After georeferencing the CTX images, I drew lines along all of the boundaries between flows. These boundaries are visible as cliffs or steep slopes in the CTX images, and as rapid elevation changes in the DEMs. In addition to flow boundaries, I mapped out a single point at the termination of each flow, all of the other linear geologic features, and the summit of Syria Mons. Once the map was created, I used ArcMap to generate a histogram of the distances between each flow termination and the summit. I also documented the specific process for using Trent Hare’s python script and MarsSI, and will make that documentation available on Dr. Christiansen’s website.
Results
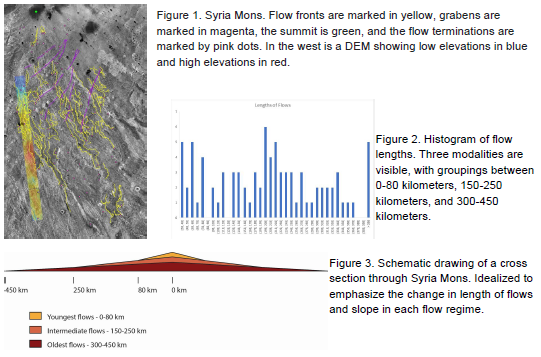
The primary result of this study is the map of Syria Mons, which is shown in Figure 1. Flows extend from the summit, shown as a green dot in the northwestern corner of the map, toward the southeast. Shown in purple are narrow grabens that trend northeast to southwest, and seem to wrap concentrically around the summit. The termination of each flow is marked by a pink point. Regionally, as can be seen by the DEM in Figure 1, the terrain slopes downward to the southeast, as the flow directions suggest. In the southwest, however, there is a small rise in elevation. A histogram of flow lengths is plotted in Figure 2, and it can be seen that there are 3 modes to the distribution. Out of 86 flows whose lengths were measured, only 7 were overlain by younger and longer flows.
Discussion
The rise in the southwest could be caused by one of two things, either magma withdrawal, which caused the summit of the mountain to subside, or a localized regional uplift that occurred subsequent to the volcanism. The magma withdrawal theory is supported by the concentric grabens, which would have formed with the magma withdrawal, although this is the less likely of the two theories. If magma withdrawal was the cause of this topographic rise, then the rise would wrap around the whole southern edge of the map area, instead of being localized in the small southwest region it actually occupies. The trimodality of the flow length distribution, combined with the fact that nearly every flow was shorter than all flows that it overlaid, suggests that there were three episodes of eruption, with flow lengths shortening over time. Figure 3 demonstrates this concept. This shortening could either have been caused by a change in eruptive volume, or a change in magma rheology.
Conclusion
Syria Mons, the largest low shield volcano on Syria Planum, had an extensive and varied eruptive history, with at least three distinct stages. More studies will be necessary to extend the map area and to determine what about the volcano changed between those stages, possibly by looking at flow thicknesses, to constrain the viscosity. The post-volcanic structures in the area are likely related to regional tectonics, as opposed to magma withdrawal, or any other volcanic process, although more inquiry is necessary into those topics as well.