
Garcia, Brandon Thomas
Expression Changes of Dopamine Type 2 Receptor on the Surface of Human Monocytes and Lymphocytes After Exposure to Dopamine In Vitro.
Faculty Mentor: Sandra Hope, PhD and Scott Steffensen, PhD, Department of Microbiology and Molecular Biology
Introduction
Dopamine (DA) is a neurotransmitter in the brain that plays a role in several functions such as reward, motivation, and dependence. The imbalance of DA in the central nervous system (CNS) can lead to several debilitating diseases like Parkinson’s Disease, Alzheimer’s, and Schizophrenia as well as drug dependence. Levels of DA in the brain are often determined by measuring the expression of Dopamine type 2 (D2) receptors by positron emission topography (PET) scans in the Nucleus Accumbens (NAc). This test which is often expensive and unavailable to many people without access to hospitals or regular healthcare.
The goal of my project was to investigate the possibility of a peripheral biomarker for CNS DA levels among white blood cells. In previous experiments, D2 receptors were shown to be expressed on the surface of lymphocytes and monocytes. The expression of D2 receptors also seemed to decrease in the lymphocyte population of individuals with Restless Leg Syndrome compared to individuals without the disease. For this experiment, we exposed monocytes and lymphocytes to DA in vitro and measured the expression of D2 receptors over a 24-hour period. We expected that the lymphocyte population would upregulate the D2 receptor over time while monocytes would not change expression.
Methods
Human samples were collected from donors by a phlebotomist or students in the BYU Medical Laboratory Science program and placed in heparinized tubes. The whole blood samples were then layered on top of Lymphocyte Separation Media and centrifuged to separate mononuclear leukocytes (monocytes and lymphocytes) from polymorphonuclear cells (granulocytes) and red blood cells (RBC). If necessary, samples were also subjected to a lysis step to remove any excess red blood cells.
Following the separation, sample monocytes and lymphocytes were suspended in cell culture media and distributed into 12 well plates. DA was added to the wells in triplicate and the plates were incubated for either 1 hour or 24 hour periods at 37°C. Following the incubation step the cells were harvested from the plates using cell scrapers and placed in 5ml FACS tubes. The samples were subjected to an Fc Block for 12 minutes to prevent nonspecific binding of antibodies, centrifuged, and then stained with an anti-D2 receptor and anti- human CD45 antibodies. Samples were then analyzed using an Attune Acoustic Focus Flow Cytometer. Analysis of data was then completed using Flow Jo Data analysis software to determine the percent D2 expression on the surface of CD 45 positive white blood cells.
Results/Discussion
We took samples of lymphocytes and monocytes from five subjects and incubated them with micro molar amounts of DA over the course of 24 hours. Upon analysis of the samples, we found four distinct groups of cells with different expression profiles for D2 receptors (Figure 1). Based on the size and granularity of the cells in the groups we determined that there were two lymphocyte populations, one monocyte population, and one populations of cells that are possibly a mixture of monocytes and granulocytes.
The data showed that one population of lymphocytes (Table 1, Lymphocyte 2) upregulate D2 receptor expression over 24 hours. However, it is unknown which type of lymphocyte is upregulating this receptor, especially since there is a second population that does not seem to express or upregulate it (Table 1, Lymphocyte 1). Determining the type of lymphocyte involved will greatly help us understand the role that DA and the D2 receptor have in the immune system and whether there is link between the receptor on lymphocytes and in the CNS.
Both monocyte populations that we examined seemed to upregulate the receptor temporarily, but return to their normal expression levels by the 24-hour mark. The populations were different in that one, which likely also contained some granulocytes, had a much higher expression of the D2 receptor than the other population (Table 1, Monocyte 1 and 2). This result could bode well for a biomarker since they are unaffected over long term periods of exposure to DA alone. However, in vivo testing and testing with other compounds, such as ethanol, will be needed to see if expression of D2 receptors on monocytes changes and if such changes correlate to changes of D2 expression in the brain.
Conclusion
This data furthers our understanding of D2 receptor expression on the surface of white blood cells and will ultimately help determine if there is a viable biomarker for DA levels in the brain. Further testing of these cells with additional staining for lymphocyte subtypes will guide our efforts in understanding the link between the periphery and the CNS. Along with those tests, we plan to continue with the original project to measure D2 expression of leukocytes compared to expression of the same receptor in the NAc. This will help us to understand if a peripheral biomarker exists for DA levels in the brain.
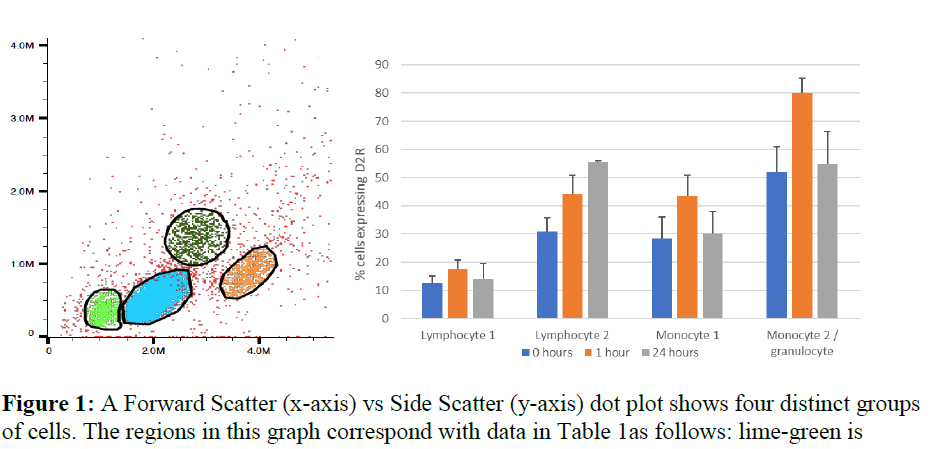
Table 1as follows: lime-green is
lymphocyte 1, blue is lymphocyte 2, orange is monocyte 1, and dark green is monocyte 2/granulocytes. Table 1: Comparing the expression of D2 receptors at 0 hours, 1 hour, and 24 hours shows how each of the different populations respond to the presence of micromolar amounts of DA.