
Samantha Sanders and Christophe Giraud-Carrier, Computer Science
Introduction
Psychiatrists at the University of Utah developed a regional quantitative brain atrophy map that they hoped to be able to use to find biomarkers for diagnosis of probable Alzheimer’s disease (AD) versus frontotemporal dementia (FTD). This brain atrophy map divides the brain into 20 regions and when a brain scan is taken, they measure the brain density, or atrophy, of each of the 20 regions. We used machine learning techniques with a set of mapped fMRI brain scans to find biomarkers corresponding to the map as well as developing a predictive model for the diagnosis of AD and FTD.
Methodology
We had 233 brain scans of people with AD or FTD. There were 197 brain scans with AD and 36 brain scans of FTD. Each brain scan had 23 attributes: 20 atrophies from each of the regions of the map, gender, age, and Mini Mental State Exam (MMSE) score which is a questionnaire that screens for cognitive impairment. The lower the MMSE score the greater the individual’s impairment.
To find biomarkers, we used attribute selection techniques to bring out the atrophies that discriminated most between diagnoses. Since there is no single best method for attribute selection, we used Weka [need citation] and ran five of them, namely Correlation-based Feature Subset Selection, Information Gain, Chi Squared feature selection, Gain Ratio, and Filtered Attribute. An attribute was deemed “informative” if it appeared in the top six of the results of at least four out of five of these techniques.
We used machine learning algorithms to produce classifiers that would distinguish between AD and FTD. Since there is no universal learning algorithm [cite NFL theorems], we ran the data through nine different machine learning algorithms from Weka, namely ZeroR, SMO with PolyKernel, SMO with Normalized PolyKernel, Logistic, Simple Logistic, C4.5, AdaBoostM1 with Decision Stump, Naive Bayes, MultiClassClassifier, and MetaCost with C4.5.
To avoid overfitting, we first split our dataset into training and test set. The samples were stratified with 80% of the data (186 patients) used for attribute selection and model induction, and the other 20% of the data (47 patients) used to assess the accuracy of the model.
Results
We found that overall, when selecting among the 20 available atrophies, atrophies 7 and 17 were the two most informative atrophies, as they appeared in the top four for all five attribute selection methods across all four class distributions. Interestingly, when also considering MMSE, gender and age, we found that age was not informative (i.e., it never appeared in the top six for any of the attribute selection methods), MMSE was informative only one of the four distributions. Given these results, and our focus on biomarkers, we built our predictive models with atrophy 7 and atrophy 17 as the only predictor (i.e., independent) variables.
Using only atrophies 7 and 17 we ran the data through the machine learning algorithms to obtain classifiers. The highest and lowest accuracy we achieved was 89%. See table below (Note that ZeroR is used as a baseline only, as it always predicts the majority class, and thus reflects the performance of an uninformed classifier):
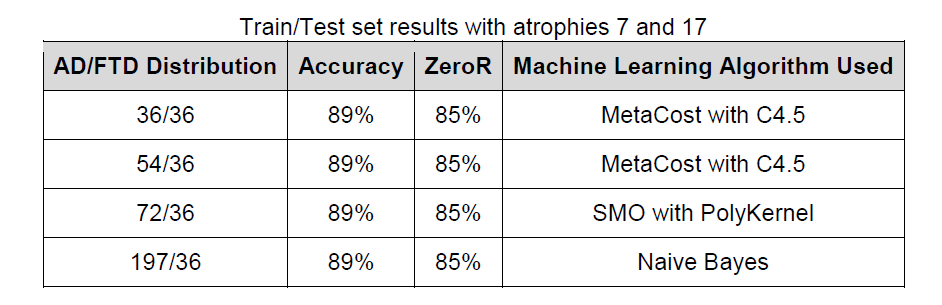
When we used all the atrophies or a larger subset of atrophies, we were able to achieve accuracies that were either less accurate or just as accurate as using only atrophies 7 and 17 with the four AD/FTD distributions.
Discussion / Conclusion
With the regional quantitative brain atrophy map and machine learning algorithms, we can distinguish between AD and FTD with 89% accuracy. We can achieve this accuracy when considering only two atrophies. Atrophies 7 and 17 correspond with the precuneus region of the brain and were highly predictive of whether someone had AD or FTD. Using more atrophies did not increase the accuracy. This could be because adding more atrophies increased the amount of noise and/or the complexity of the relationships between atrophies. Since we were able to achieve such a high accuracy, the regional quantitative brain atrophy map along with these machine learning methods have the potential to help clinicians diagnose patients.
It is interesting that MMSE is not very predictive of someone’s diagnosis because this could mean that MMSE alone is not sufficient to diagnose someone as having AD or FTD, but it can be helpful when used in conjunction with the atrophy map.
Publications
This work was presented in a poster at the world’s top brain imaging conference, and a paper is being prepared based on these results for submission to a journal.