
Carly Hyatt and Dr. Gustavious P. Williams, Civil and Environmental Engineering
Introduction
Over the past year, I have gathered 25 Landsat images for calibration and processing and in-field measurements over 25 years to develop seasonal chlorophyll detection models for the north-central Utah region. High chlorophyll levels indicate large algal blooms and large nutrient loading. Knowing these trends can help agencies and management to mitigate nutrient loading and make changes to monitoring.
Methodology
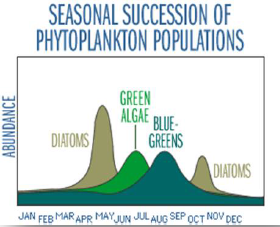
The major innovation in this project was to develop models that more closely follow the seasonal succession of algal populations in the reservoirs. Traditionally, chlorophyll detection models are developed for the late summer months, when blue-green algae are typically at a maximum for temperate reservoirs. This can be problematic, as it does not consider the other populations of algae such as diatoms or green algae, which also have negative effects on the water quality and recreational use of the reservoir. According to data collected by the Central Utah Water Conservancy District, 39% of the maximum chlorophyll levels occurred during the early months of the summer (an equal percentage as the late summer) implying that the early months are also important to monitor. Additionally, a stepwise regression was used to test all Landsat reflectance ranges as possible parameters for estimating chlorophyll rather than limiting the model to traditional reflectance parameters.
Results
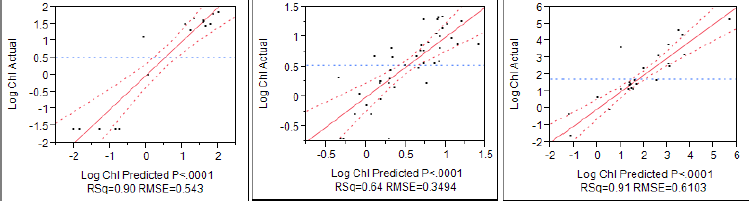
The final model predictions are plotted against the actual measured values below.
After performing the regression, the models were tested to see how the late model performed throughout the rest of the growing season. As expected, it had a much lower ability to estimate chlorophyll in the early and middle months than the models developed specifically for those months.
Discussion
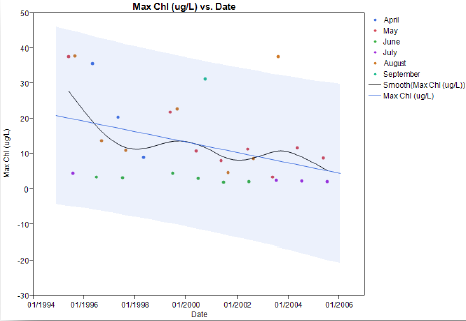
The most valuable products of this work are the historical trends and spatial distributions of chlorophyll. The following figure shows an example of the trends for Deer Creek Reservoir from 1995 to 2005. This plot shows that the overall trend of the chlorophyll is decreasing, and the values during April and May are consistently higher than those in the middle and later months. This information backs up the belief that chlorophyll should be monitored throughout the entire growing season, and not be limited to the late summer months.
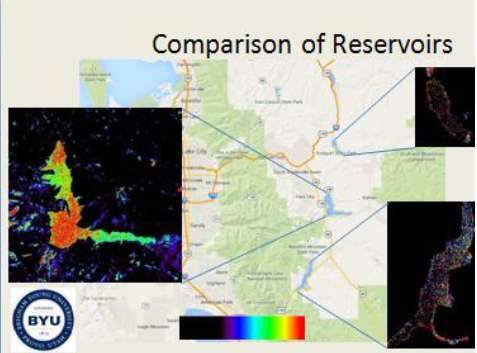
Finally, the spatial distribution maps in the next figure demonstrate the ability of remote sensing to assist in monitoring and management planning. Each reservoir was from the same image from May of 2001. It is interesting to note the distribution of chlorophyll values (algae blooms). Above the dam and near the north arm of the reservoir, there is a much greater concentration. Understanding where these blooms occur in the reservoir could help in knowing where to sample and can provide supplementary information to the limited data provided by field sampling.
Conclusion
This project helped me gain experience in data collection and management and working with government agencies and their limited resources. I was able to present my results at the North American Lake Management Symposium in November, which helped me connect to professionals and others involved in this area of research. I also had the opportunity to meet with members of the Oregon Fish and Wildlife Service who later came to BYU so I could help implement these methods for their own monitoring program.