Clarence J. Wilson III, Department of Electrical and Computer Engineering
Introduction
The European Remote Sensing satellite, ERS-1, carries a scatterometer radar which measures the radar backscattering coefficient (rr.) over the entire earth. The primary purpose of this measurement is to determine wind speeds and directions over the ocean. Recently, however, scientists have begun considering the use of ERS-1 backscatter measurements over land surfaces (Mougin et a!., 1995; Kennett and Li, 1989a; Kennett and Ll, 1989b). The ERS-1 scatterometer measurement data provides 50 km resolution of these surfaces and repeated coverage every 4-10 days. While this temporal repetivity is very good, the spatial resolution is extremely low and thus limits applications of such land studies.
Researchers in the Microwave Earth Remote Sensing (MERS) group here at BYU have been actively developing a technique for enhancing the resolution of scatterometer data (Long et al .. 1993). This resolution enhancement technique, called Scatterometer Image Reconstruction (SIR), appears to have the ability to increase resolution from the original 50 km up to 8.9 km. SIR imagery, along with the frequent coverage of spaceborne scatterometers like ERS-1, is hoped to aid in the study of large land regions with ecological significance. Such research has already shown SIR’s usefulness in the study of the Amazon rainforests (Long and Hardin, 1994) and Antarctic sea ice (Long eta!., 1994).
Application of SIR to Boreal Forests
This research report, funded by the Office of Research and Creative Work, represents the initial steps in applying the SIR technique to the Canadian Boreal forests. Boreal forests are huge coniferous forests characterized by needleleaf deciduous and needleleaf evergreen trees (common varieties are spruce, pine, fir, aspen, birch, hemlock, and larch), and lichen woodlands. They are typically found north of the 50″‘ North parallel and south of the Arctic. Ecologically, they fit between arctic tundra and broadleaf deciduous hardwoods. Because they cover such massive regions (15 million km2 worldwide), Boreal forests are an important factor in understanding the global ecosystem (Shugart et al., 1992).
In order to investigate the potential of SIR in studying Boreal forest regions, the following procedure was adopted. First, I selected the Canadian Boreal Forest as a test region. Specifically, I included the region between latitudes 50′ Nand 70′ Nand between longitudes 140′ Wand 55′ W. I then extracted the original raw data for this region from ERS-1 CDROM archives. The data was grouped into 14 day periods from january 1, 1992 through March 15, 1995 (the extent of the data at the time). Next, I processed each data group using the SIR algorithm and produced an 8.9 km/pixel resolution image of each time period.
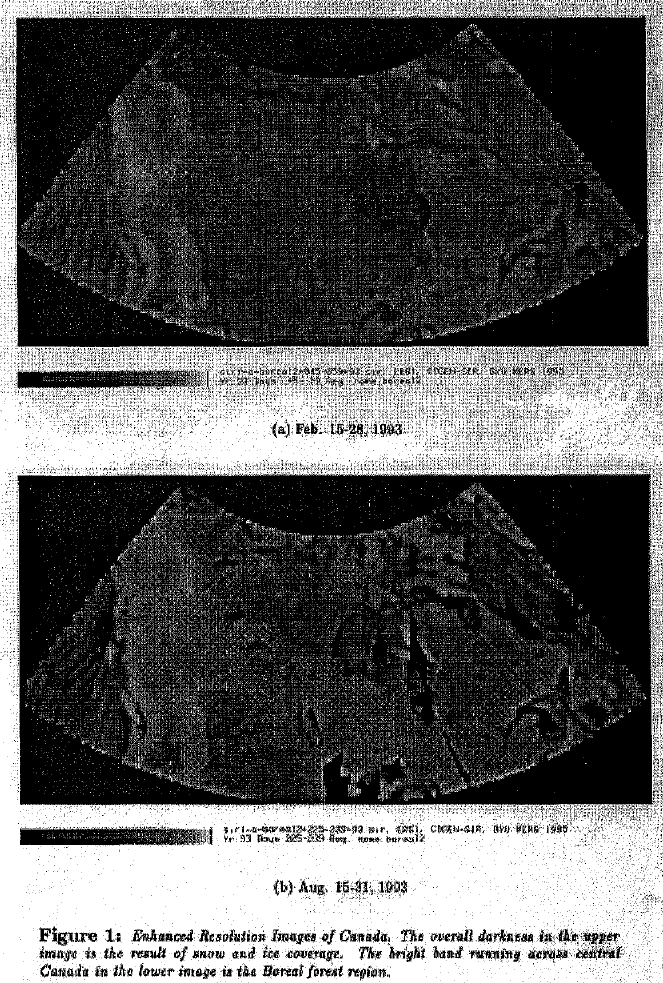
Fig. 2 shows two SIR images thus produced. Fig. 2(a) shows the region during February 15-28, 1993. Snow and ice present during this wintery period makes the overall image appear relatively dark. The bright features running north-to-south along the west coast are the Rocky Mountain. The dark region west of that is the Pacific ocean. Near the center of the image is the Hudson Bay. There is not much distinction, however, over the majority of the land mass (due to the snow and lee cover mentioned above). Thus, it seems that differentiating Boreal forests from other vegetation types is not feasible during the winter months. Fig 2(b) shows the region from August 15-31, 1993. Here, a distinctive band running east-to-west through the center of Canada is readily apparent. This is the general vicinity of the Boreal forests. The slightly darker region south of the Boreal forests and to the east of the Rocky Mountains is the northern extent of the grasslands of the Great Plains. The many new black spots throughout the image are lakes which were covered with ice in the February image.
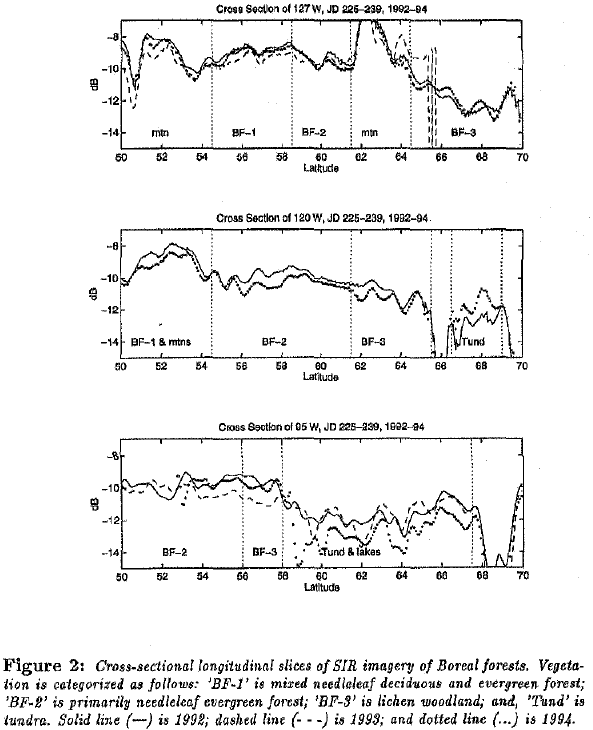
Having produced the SIR images and made the above qualitative observations, I next needed to do some quantitative analysis to attempt to classify vegetation types. Because the Boreal forest region was so much more apparent in Fig. 2(b), I used this image for my analysis. First, longitudinal cross-sections of the image were taken along the 127′ W, 120′ W, and 95’ W longitudes. The backscatter coefficients (a.) along these cross-sections, measured in decibels [dB] are plotted for the same time period (Aug. 15-31) for 1992, 1993 and 1994 in Fig. 2.
The information in Fig. 2 is very pleasing and suggests great potential for analyzing SIR imagery over Boreal forests. The plots are sectioned by vegetation type with vertical lines. This sectioning is based on information from “Canada Natural Resources”, a map classifying Canada’s vegetation regions produced by the Department of Mines, Energy and Technical Surveys.
Three sub-types of Boreal forest are identified. The exciting information is their different backscatter responses. The subtype with needleleaf deciduous and evergreen trees has slightly greater response than that with only evergreen trees. Further, the lichen woodland has a markedly reduced response. The tundra regions, having the least vegetation, is significantly less responsive still. However, while this data indicates that the different vegetation types do yield decreasing backscatter response as vegetation density decreases, topographical features (mountains and bodies of water) seem to have an even greater impact on the backscatter. Further analysis is needed in order to determine the topographical impact and to adjust for it in the data. Nonetheless, a clear trend is apparent in backscatter versus vegetation type.
Conclusion
Study of the Boreal forest regions using enhanced resolution imagery produced by the SIR algorithm has demonstrated that the Boreal forests and even sub-types of Boreal forests are distinguishable from other vegetation types. This is an important step in developing SIR imagery as a tool for the ecological study of Boreal forests on a global scale. While further analysis is needed in order to quantify classification parameters, this initial analysis indicates that such a pursuit will be fruitful. Finally, the availability of older scatterometer data (such as Seasat, 1978) is hoped to provide a means of relatively long-term temporal comparisons. I express my appreciation to the Office of Research and Creative Work for their support of my research. I will be continuing this study this fall for my Senior Project in my Bachelor’s program in Electrical and Computer Engineering. My advisor, Dr. David Long, and I anticipate the completed analysis being submitted for publication in related professional journals.
References
- Kennett, R. and F. Li, “Seasat over Land Scatterometer Data, Part 1: Global Overview of the Ku-band Backscatterer Coefficients.” I.E.E.E, Transactions on Geoscience and Remote Sensing, vol. 27, pp. 592-605, 1989a.
- Kennett, R. and F. Li, “Seasat over Land Scatterometer Data, Part II: Selection of Extended Area Land-target Sites for the Calibration of Spaceborne Scatterometers.” I.E.E.E. Transactions on Geoscience and Remote Sensing, vol. 27, pp. 779-7881 l989b.
- Long, D., D. Early, and M. Drinkwater, “Enhanced Resolution ERS-1 Scatterometer Imaging of Southern Hemisphere Polar Ice.” IGARRS ’94, vol. I, pp. 156-158, 1994.
- Long, D., P. Hardin, and P. Whiting, “Resolution Enhancement of Spaceborne Scatterometer Data.” l.E.E.E. Transactions on Geoscience and Remote Sensing, vol. 31, no. 3, pp. 700-715, 1993.
- Long, D. and P.]. Hardin, “Vegetation Studies of the Amazon Basin Using Enhanced Resolution Seasat Scatterometer Data.” l.E.E.E. Transactions on Geoscience and Remote Sensing. vol. 32, no. 2, pp. 449-460, 1994.
- Mougin, E., A. Lopes, P. Frison, and C. Proisy, “Preliminary Analysis of ERS- 1 Wind Scatterometer Data over Land Surfaces.” International Journal of Remote Sensing, vol. 16, no. 2, pp. 391-398, 1995.
- Shugart, H., R. Leemans, and G. Bonan, eds .. A Systems Analysis of the Global Boreal Forest. Cambridge University Press, Cambridge, Great Britain, 1992.